Data & Reports
Air quality assessment data and related reports.

Monitoring Methods
Air monitoring methodologies can be divided into three main types, covering a wide range of costs and performance levels. The methods and their relative merits are shown below. The use of a particular type of monitoring equipment may need to be justified in review and assessment reports and therefore should be chosen appropriately.
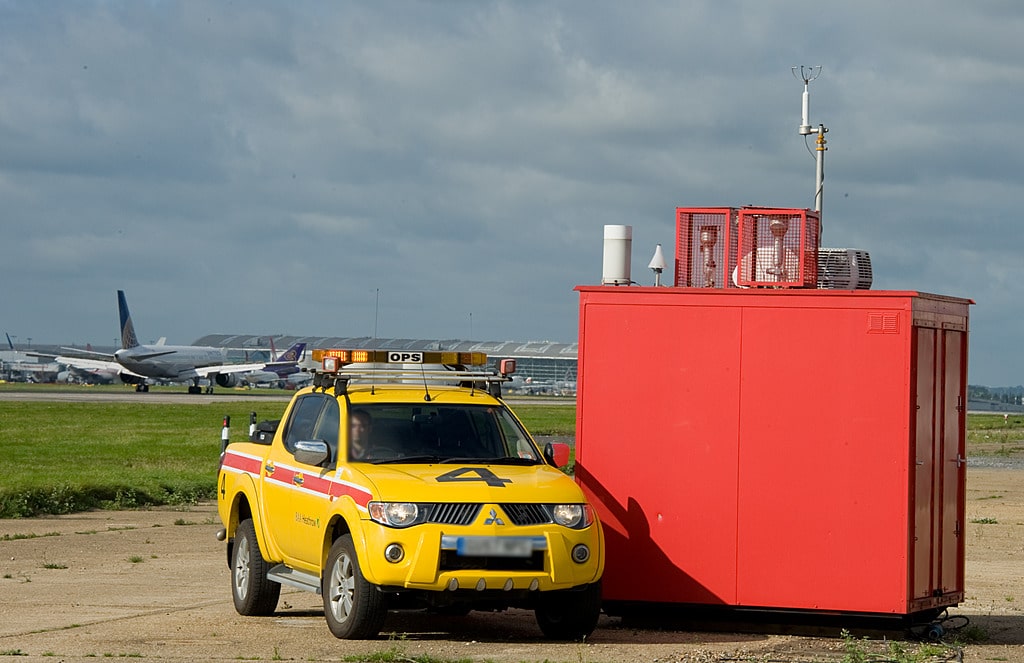
Point monitoring
These are the most sophisticated (and usually the most expensive) air quality monitoring systems. Automatic analysers draw in ambient (outdoor) air, and measure the concentration of the pollutant in the sampled air.
Automatic monitoring techniques are used in Heathrow for oxides of nitrogen, ozone and particulate matter (PM10 and PM2.5).
Automatic air quality monitoring systems produce high-resolution measurements (typically hourly or shorter period averages), which can be communicated to the public in near-real time, using telemetry.
In order to ensure that the data produced are accurate and reliable, a high standard of operation is required, including regular maintenance, calibration, and detailed quality assurance/quality control procedures.
Advantages
Real-time collection, analysis and data reporting
Disadvantages
Expensive. Regular trained operator maintenence required.
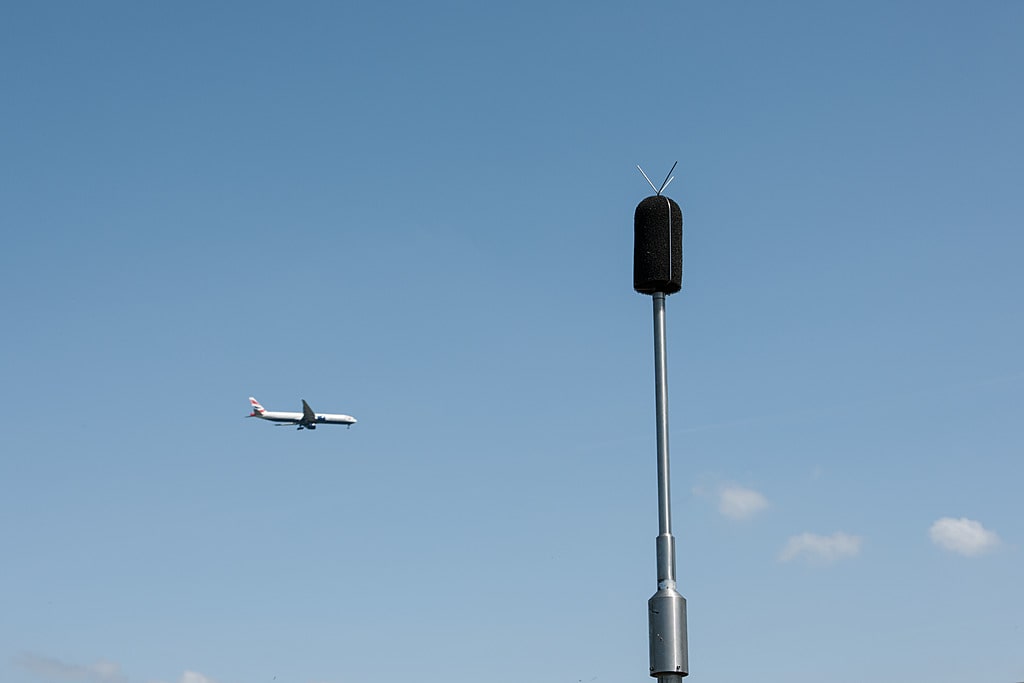
Passive Sampling
Passive sampling using ‘Diffusion tubes’ offer a simple and cost-effective method of monitoring to give a good general indication of average pollution concentrations.
Advantages
Low cost - simple. Useful for screening and base-line studies and in support of automatic monitoring for Detailed Assessments.
Disadvantages
Unproven for some pollutants. Laboratory analysis required. In general, only provide weekly or longer averages.
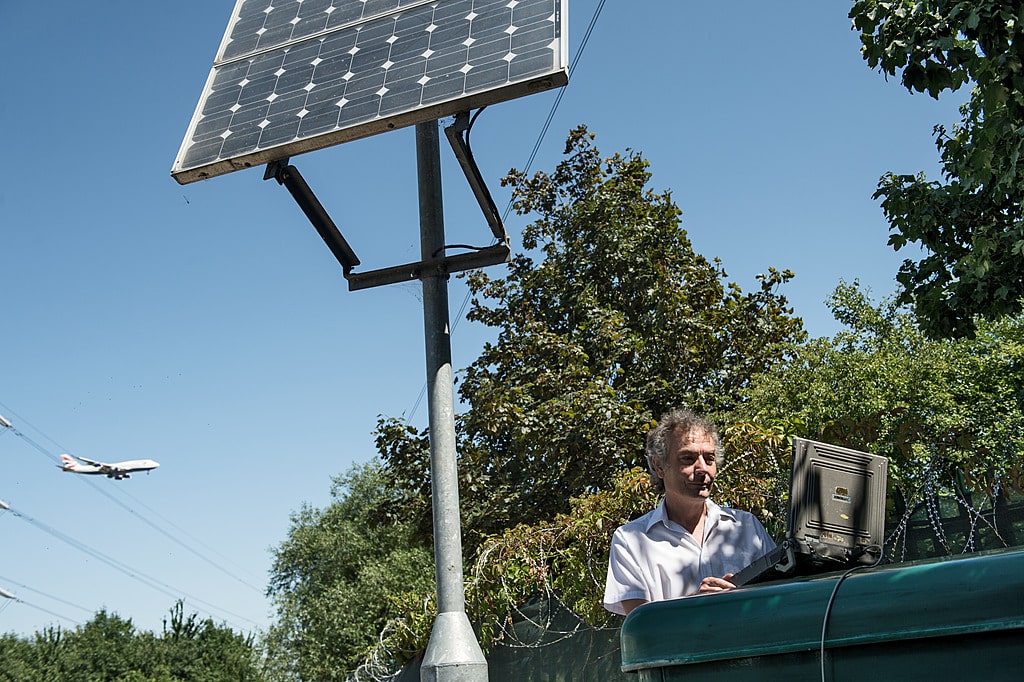
Sensor monitoring
Sensor monitors offer a simple and cost-effective method of monitoring to give a good general indication of average pollution concentrations.
They are typically battery powered and can be used at fixed locations (e.g. attached to a lamppost) or handheld for mobile pollution studies.
They can provide very highly time resolved data – 1 minute average or less – and because of the lower costs can be deployed in larger numbers than conventional automatic analysers.
Advantages
Lower cost - simple to use. Can be used as a portable sensor. Can run on either mains or solar power.
Disadvantages
Not as accurate as other monitoring methods listed here.
Monitoring Data
Automatic data is available for download, use the links below to find the data you’re interested in. If you’re looking for estimates of emissions – the amount of pollution produced by a range of activities can be obtained from the National Atmospheric Emissions Inventory (NAEI)
Latest Data Trends
Download the latest data trends below
Automatic Monitoring
Automatic Monitors measure hourly pollutant concentrations from a continuous stream of air pumped through the analysers. The data is corrected, maintained, and calibrated on a regular basis to ensure data is accurate and reliable.
Non-Automatic Monitoring
These monitoring locations measure less frequently - exposure of the tube is usually on a weekly or monthly basis. Samples are collected by chemical reaction on a filter or substrate within the tube and then sent off to a laboratory for analysis. Final pollutant concentrations are calculated from these results and the results can take several months to be published. Non-automatic monitoring is carried out by local authorities and data is available from their Air quality websites listed in the LAQM section below.
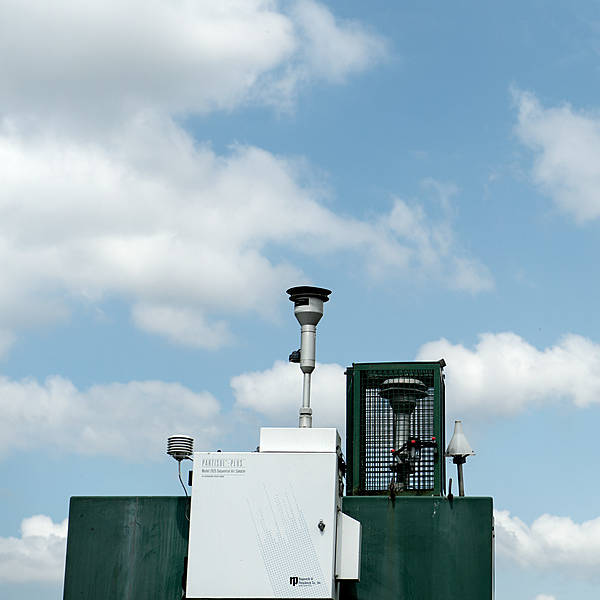
Site locations
The monitoring site locations within the Heathrow Airwatch network used to define where air quality is measured are defined below.
Airport
Monitoring within the boundary of an airport perimeter.
Source: Aircraft, vehicle, commercial, space heating.
Objectives: Determine air quality impact of airport.
Roadside
A site sampling between 1m of the kerbside of a busy road and the back of the pavement. Typically this will be within 5m of the road, but could be up to 15m.
Source: Local Traffic
Objectives: Assessing worst case population exposure. Evaluating impacts of vehicle emission controls. Determining impacts of traffic planning/calming schemes.
Suburban
A location type situated in a residential area on the outskirts of a town or city.
Source: Traffic, commercial, space heating, regional transport, urban plume downwind of a city.
Objectives: Traffic and land-use planning. Investigating urban plumes.
Urban Background
An urban location distanced from sources and therefore broadly representative of city-wide background conditions e.g. urban residential areas.
Source: Vehicle, commercial, space heating.
Objectives: Trend analysis. Urban planning.Traffic and land-use planning.
Urban Centre
An urban location representative of typical population exposure in towns or city centres e.g. pedestrian precincts and shopping areas.
Source: Vehicle, commercial, space heating.
Objectives: Identification of long-term urban trends.
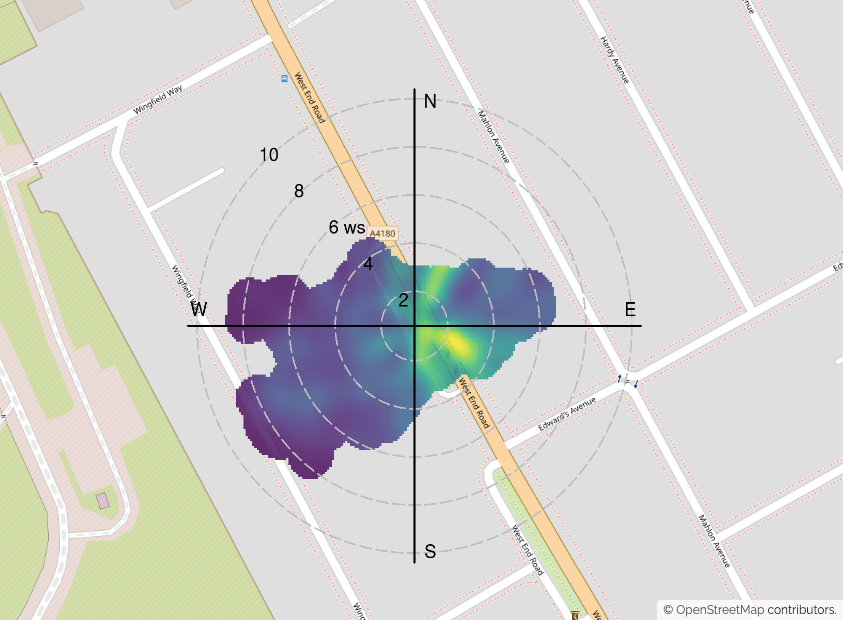
Polar Plots
Find out more about polar plots and how each pollutant moves depending upon the wind speed and wind direction.
Reports
There are many reports on air quality produced each year at a national, regional and local level.
The reports fit into a two main categories:
Government policy and scientific reports
These will include the latest documents relating to the UK Air Quality Strategy, together with guidance notes for local authorities on how to implement the local Review and Assessment of Air Quality.

Government policy and scientific reports
These will include the latest documents relating to the UK Air Quality Strategy, together with guidance notes for local authorities on how to implement the local Review and Assessment of Air Quality.
There are also documents relating to the implementation of European Directives, publications from government sponsored expert review groups on air quality, and government press releases relating to the latest air quality trends or high air pollution episodes.
All the documents can be found on the Defra website's air quality pages.

UK Monitoring and Scientific reports
These are published by Defra, DH, various consultants and other research groups.
Reports include the strategic policy analyses which support the UK Air Quality Strategy, together with progress reports on the UK air quality monitoring networks, air quality forecasting and UK air quality dissemination systems.
There are also reports on UK air pollution emissions, trends and long-term forecasts. These scientific and progress reports are published in a comprehensive downloadable database on the Library section of the Defra UK-AIR website.

Regional Research Reports and Papers
The Imperial College Environmental Research Group (ERG) publishes scientific papers relating to air quality across London, as well as progress reports on the latest results from the London air quality monitoring network.
Local Air Quality Management (LAQM)
All UK local authorities have been tasked with reviewing their local air quality to assess whether it will meet UK government (and European) targets for future years.
The following documents are available to download from this website:
Documents and reports relating to local air quality and review and assessment can be found on the individual web pages of the Heathrow Airwatch consortium partners as follows. All links open in a new window.
Air Quality Strategy
Quarterly Reports
Briefing reports
Annual reports